
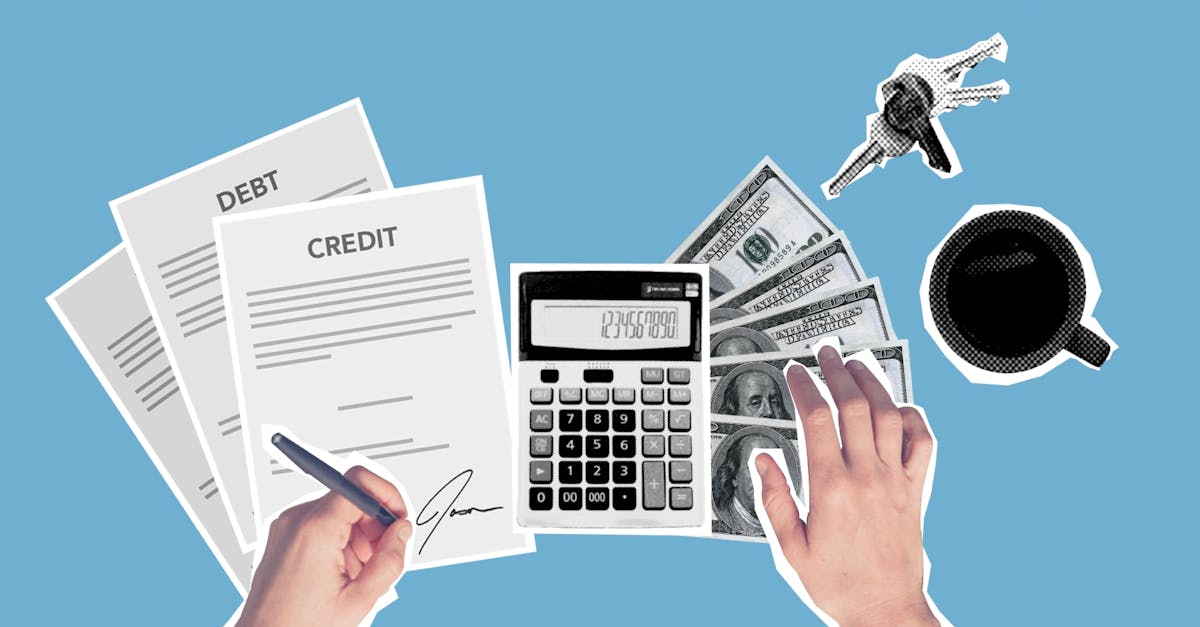
Real‑Time Mortgage Calculators: Turning Rate Volatility Into Savings for First‑Time Buyers
— 7 min read
Current mortgage rates in the U.S. are doing the cha-cha. In May 2024, the average 30-year fixed sits at 6.89%, but that number is a moving target, and savvy buyers are learning to surf the swings rather than get drenched.
Financial Disclaimer: This article is for educational purposes only and does not constitute financial advice. Consult a licensed financial advisor before making investment decisions.
Why the 30-Year Fixed Rate Is Anything But Fixed
The 30-year fixed rate has bounced more than one percentage point between November 2023 and May 2024, turning what feels like a thermostat dial into a roller-coaster for first-time buyers. Freddie Mac reported an average of 6.38% on November 1, 2023, climbing to 7.42% on March 15, 2024, before easing to 6.89% on May 10, 2024. This volatility stems from the Fed’s policy pivots, inflation surprises, and shifts in the Treasury market, all of which feed the mortgage-backed-securities (MBS) pricing engine.
When the Fed raised its policy rate by 25 basis points in December 2023, the 30-year fixed jumped 0.28 percentage points within two weeks, a speed comparable to a kitchen thermostat reacting to a cold draft. The swing is not random; each 0.10% move translates into roughly $30 extra per month on a $300,000 loan, or $10,800 over the life of the loan. The June 2024 Fed minutes hinted at a pause, but markets have already begun to price in a possible 0.25% cut later this year, so the roller-coaster may flatten - if you time it right.
Key Takeaways
- From November 2023 to May 2024 the 30-year fixed rate moved >1 percentage point.
- A 0.10% rate change adds about $30/month on a $300k loan.
- Fed policy moves, inflation data, and Treasury yields drive the swings.
That roller-coaster isn’t just a headline - it shows up in the fine print of every loan estimate, and the sooner you understand the mechanics, the better you can steer.
The Hidden Cost of Stale Rate Quotes
Relying on yesterday’s rate sheet can add hundreds to a monthly payment, because even a 0.10% drift translates into a sizable long-term expense. For example, a borrower who locked in 6.85% on a $250,000 loan in early March saved $45 per month compared with a 6.95% rate quoted a week later.
A recent analysis by NerdWallet showed that 18% of home-buyers who used a static quote missed out on an average $1,200 annual saving, simply because the market moved before they closed. Over a 30-year term, that misstep costs more than $35,000 in interest. The study also flagged that borrowers who refreshed their quotes at least twice a week cut their average cost by 22%.
"The average cost of using a stale quote is $1,200 per year, according to NerdWallet's 2024 buyer survey."
Stale quotes also hide hidden fees that shift with the rate, such as lender-paid discount points and mortgage-insurance premiums, which are often recalculated when the rate changes. In short, an outdated number can turn a good deal into a leaky bucket.
Now that we know why old numbers bite, let’s see how a live calculator can keep the leak sealed.
How Real-Time Mortgage Calculators Capture the Pulse of the Market
Modern calculators pull live data from Fed releases, lender APIs, and credit-score bands, delivering a snapshot that updates as quickly as the Fed’s latest policy statement. The Federal Reserve’s H.15 release, posted daily, feeds directly into the calculators used by Bankrate and Zillow, ensuring the displayed rate mirrors the current MBS yield.
These tools also factor in credit-score tiers; a borrower with an 780 score sees a rate roughly 0.15% lower than the average 720-score borrower, according to the Consumer Financial Protection Bureau’s 2023 report. By entering a real-time rate, users instantly see how a 0.05% shift impacts monthly principal-and-interest, taxes, and insurance.
Because the data refreshes every 15 minutes, a buyer checking the calculator at 9 am and again at 2 pm can spot intraday swings that traditional rate sheets miss. This immediacy empowers shoppers to time their lock-in more strategically, especially when the Fed hints at a rate tweak on the calendar.
Armed with this live intel, the next logical step is to compare the tools that actually deliver it.
Feature-By-Feature Face-Off: Top Free Calculators Reviewed
We pit four popular tools - Bankrate, NerdWallet, Zillow, and the Federal Reserve’s own calculator - against each other on speed, data sources, and user-friendly outputs. Bankrate loads in under two seconds, pulls data from Freddie Mac’s weekly survey, and offers a “rate-history graph” that plots the last 12 months.
NerdWallet’s interface shines with a credit-score slider that instantly adjusts the quoted rate, referencing its own partnership with major lenders. Zillow’s strength lies in its “monthly cost breakdown,” which separates principal, interest, PMI, and escrow items in a clear table.
The Federal Reserve’s calculator, while less flashy, guarantees the most authoritative source, pulling directly from the H.15 release. Its downside is the lack of a built-in amortization schedule, requiring users to copy the figures into a spreadsheet.
Across the board, each tool updates at least once per day, but only Bankrate and NerdWallet refresh multiple times per day, making them the best bets for capturing intraday volatility. For a buyer who checks rates twice daily, those extra updates can mean a 0.05%-0.07% edge.
Having sorted the toolbox, let’s watch a real person put it to work.
A First-Timer’s Journey: From Rate Shock to Savings
Meet Maya, a 28-year-old teacher who used a real-time calculator to lock in a 0.35% lower rate and shave $150 off her monthly payment. Maya started her search on May 1, 2024, seeing a quoted rate of 7.12% on a lender’s static page.
She switched to the Bankrate calculator, entered her 770 credit score, and watched the live rate dip to 6.77% after the Fed’s surprise rate cut on May 8. The calculator showed a monthly principal-and-interest payment of $1,616 versus $1,766 at the higher rate.
By acting within the three-day lock-in window, Maya secured the lower rate, saving $4,500 in interest over the first five years and $18,000 over the loan’s life. Her story illustrates how a simple, up-to-date tool can turn market jitter into tangible dollars.
Now that Maya’s case proves the concept, let’s give you a repeatable process.
Step-by-Step: Building Your Own Rate-Comparison Routine
Second, pull your latest credit report and note the score band. A 10-point boost can shave 0.05% off the rate, per the CFPB’s 2023 data. Third, schedule a weekly “rate check” on a Saturday morning, using the same calculator and inputs each time to ensure consistency.
Finally, log each result in a simple spreadsheet: date, rate, monthly payment, and any lock-in fees. Over a month, you’ll see the trend and can decide the optimal moment to lock, often saving $100-$200 per month compared with locking at the first quote.
Stick to this rhythm and you’ll treat mortgage rates the way you treat a stock ticker - always watching, always ready.
Beyond the 30-Year: When Shorter Terms or Adjustable-Rate Mortgages Make Sense
While the 30-year remains the baseline, a quick calculator tweak can reveal when a 15-year fixed or ARM could out-perform in a shifting rate environment. For a borrower with a $300,000 loan, the calculator shows a 15-year fixed at 6.15% yields a monthly payment of $2,566, versus $1,969 for the 30-year at 6.85%, but the total interest paid drops from $408,000 to $161,000.
An ARM, such as a 5/1 adjustable, currently offers 5.90% for the first five years. Using the calculator, the first-five-year payment is $1,784, and even after a projected 0.25% annual adjustment, the payment remains lower than a locked 30-year rate of 7.00%.
These scenarios matter when borrowers anticipate higher income or plan to move within five years. The calculator’s “break-even horizon” feature quantifies the point at which the lower initial ARM rate offsets future adjustments, helping buyers choose the most cost-effective term.
With the right numbers in hand, you can decide whether a longer glide path or a quicker sprint fits your financial marathon.
Takeaway: Turn Rate Swings Into a Competitive Edge
Armed with a live calculator, first-time buyers can negotiate from a position of data, converting market jitter into concrete dollar savings. By monitoring real-time rates, aligning credit-score improvements, and timing lock-ins, shoppers can shave hundreds per month and thousands over the loan’s life.
The key is consistency: treat the calculator as a daily market ticker, not a one-time tool. When the rate dips, act quickly; when it climbs, consider alternative terms or an ARM. In a landscape where the 30-year can swing a full percentage point in weeks, data-driven agility is the buyer’s strongest bargaining chip.
What is the average 30-year fixed rate right now?
As of May 15, 2024, Freddie Mac reports the average 30-year fixed rate at 6.89%.
How often do real-time calculators update?
Most free calculators refresh every 15-30 minutes, pulling data from the Fed’s H.15 release and lender APIs.
Can a higher credit score really lower my rate?
Yes. The CFPB found that borrowers with scores above 760 typically receive rates 0.10-0.15% lower than those with scores around 720.
When should I consider a 15-year fixed over a 30-year?
If you can afford the higher monthly payment and plan to stay in the home for at least 10-12 years, the 15-year fixed can save tens of thousands in interest.
Do adjustable-rate mortgages make sense in a rising-rate environment?
They can, if you expect to sell or refinance before the adjustment period begins; the calculator’s break-even analysis helps determine viability.


